Analytics & Reports
Analytics gives you data-driven insights into student performance, exam effectiveness, and overall institutional health.
Who can access this? Organization Admin, Branch Admin, Instructor (own classes)
Analytics Dashboard
Go to Analytics from the sidebar to see the analytics overview.
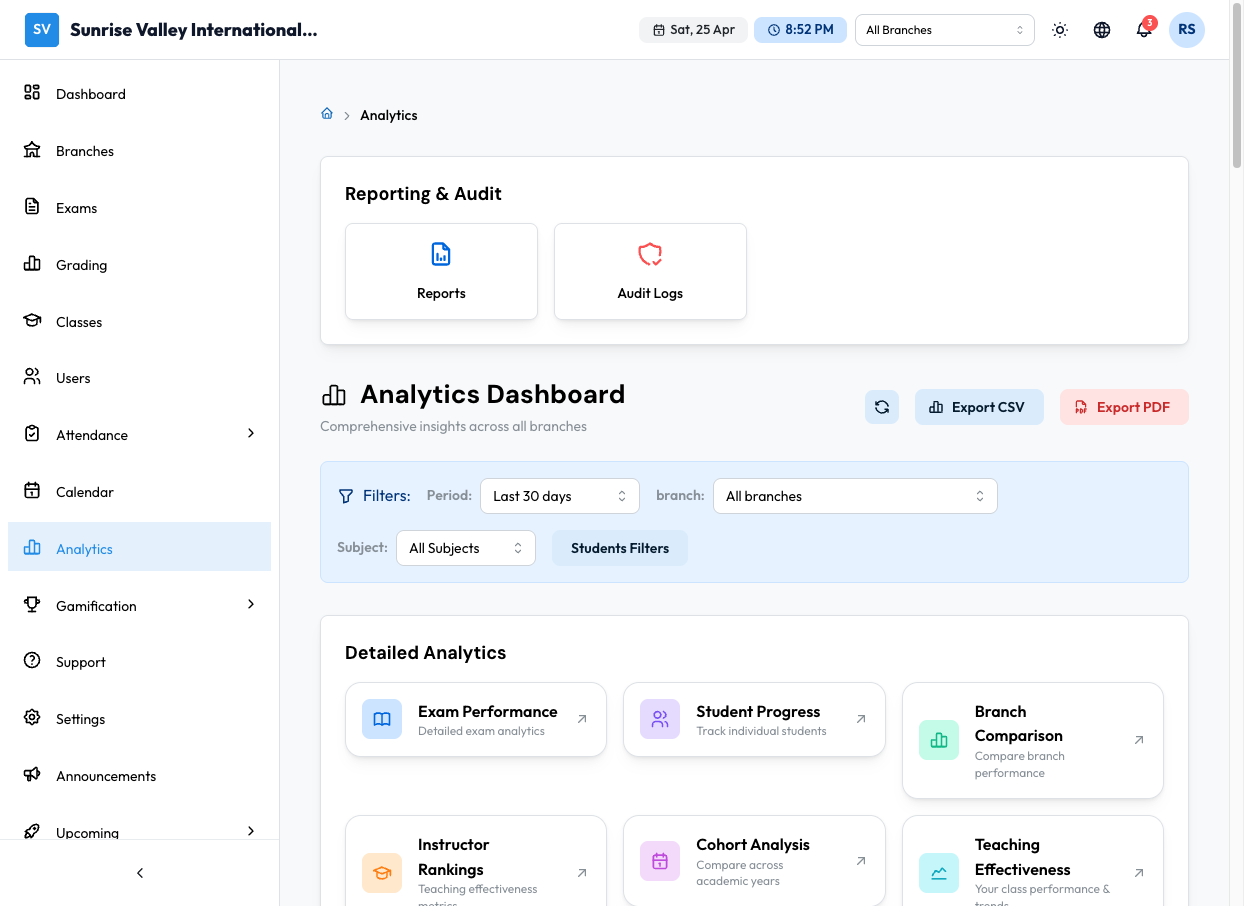
Filters
Filter analytics by:
- Period — Last 7 days, Last 30 days, Last 3 months, Last year, Academic Year, All time, or Custom range
- Branch — All branches or a specific branch
- Subject — All subjects or a specific subject
- Students — Filter by student
Quick Actions
- Refresh data — Reload analytics with latest data
- Export CSV — Download analytics as CSV
- Export PDF — Download analytics as PDF
Overview Stats
| Stat | Description |
|---|---|
| Total Branches | Number of branches in the organization |
| Students | Total student count with growth percentage |
| Exams | Total exams with growth percentage |
| Total Attempts | Total exam attempts across all exams |
Detailed Analytics
Six analytics sections accessible via cards:
| Section | Description |
|---|---|
| Exam Performance | Detailed exam analytics — attempt counts, average scores, score distributions, question-level analysis |
| Student Progress | Track individual students — performance trends, subject-wise strengths/weaknesses, comparison with class average |
| Branch Comparison | Compare branch performance — student counts, pass rates, average scores, trends |
| Instructor Rankings | Teaching effectiveness metrics — class performance, student outcomes |
| Cohort Analysis | Compare performance across academic years |
| Teaching Effectiveness | Your class performance and trends (for instructors) |
Analytics Sections in Detail
User Growth Trends
Monthly user acquisition, engagement, and retention:
- New (3mo) — New users in the last 3 months
- Churned (3mo) — Users who left in the last 3 months
- Active Growth — Growth percentage
- Net Growth — Net new users
- Line chart showing user growth over time
Engagement Metrics
Daily active users and session activity:
- Avg DAU — Average daily active users
- Avg Sessions — Average sessions per day
- Avg Duration — Average session duration
- Line chart showing engagement over time
Subject Performance
Average scores and pass rates by subject:
- Bar chart showing scores across all subjects
- Table with columns: Subject, Avg Score, Pass Rate, Exams, Status (Excellent/Good/Needs Improvement)
Score Distribution
Grade breakdown across all exams:
- Pie chart showing grade distribution
- Passing rate percentage
- Breakdown by grade: A (90-100%), B (80-89%), C (70-79%), D (60-69%), F (<60%)
Performance Trends Over Time
Track exam performance, pass rates, and activity trends:
- Avg Score — Overall average score
- Avg Pass Rate — Overall pass rate
- Total Exams — Number of exams
- Total Attempts — Number of attempts
- Line chart showing trends over time
Class Comparison
Compare performance metrics across classes:
- Table with columns: Class, Learners, Avg Score, Pass Rate, Completion, Trend (up/down arrow)
- Summary showing best performing and needs attention classes
At-Risk Students
Students who may need intervention:
- Risk level breakdown: High Risk, Medium Risk, Low Risk
- Table with columns: Student, Class, Avg Score, Pass Rate, Risk Level, Last Active, Action (Send email)
- Risk is calculated based on average score, pass rate, completion rate, recent activity, and performance trend
Exam Performance Highlights
Top and bottom performing exams:
- Best Performing — Top 3 exams by average score with pass rate and difficulty calibration
- Needs Attention — Bottom exams with lower scores
- Most Popular Exams — Exams with highest attempt counts
- Summary: Total Exams, Highest Avg, Lowest Avg
Branch Performance Comparison
Compare performance across branches:
- Each branch shows: Students, Exams, Pass Rate (progress bar), Average Score (progress bar)
- Trend indicators: Rising (up arrow), Stable (right arrow), Declining (down arrow)
Reporting & Audit
Two additional tools at the top of the analytics page:
- Reports — Structured report generation
- Audit Logs — Chronological record of all activities in your organization
Audit Logs
Go to Audit Logs from the analytics page to view a chronological record of all activities in your organization.
Audit logs track:
- User login/logout events
- Data creation, updates, and deletions
- Settings changes
- Exam submissions and grading actions
Filters available:
- User — Filter by who performed the action
- Action type — Filter by event type
- Date range — Filter by time period
Tips
- Check the At-Risk Students section regularly to identify students who need help early
- Use Class Comparison to identify which classes are performing well and which need support
- Exam Performance Highlights helps you identify exams that may need question revision
- Use Export CSV or Export PDF to share analytics reports with stakeholders